

Readers can download free PDF copies by clicking on the icons above.
Feel free to circulate or cite in your work. But citations must attribute to the original source.
Global Justice Index Report
Fudan Institute for Advanced Study in Social Sciences (Fudan IAS)
December 2019
The Fudan IAS acknowledges the generous support it has received from institutions such as the Fudan University School of International Relations and Public Affairs, the Shanghai “Gao Feng” Disciplinary Supporting Funds, Global Policy, Rutgers University, as well as useful comments and suggestions on this report from the following individuals: Arthur Boutellis (International Peace Institute), Daniel Callies (UC San Diego), Jean Marc Coicaud (Rutgers University), Selda Dagistanli (Western Sydney University), Marco Dugato (Università Cattolica del Sacro Cuore), Sakiko Fukuda-Parr (The New School, New York), Yannick Glemarec (Executive Director, UN Green Climate Fund), Carlos Manuel Gradin Lago (UNU-WIDER, United Nations University World Institute for Development), Terry Lynn Karl (Stanford University), Milorad Kovacevic (Chief of Statistics, UN Human Development Report Office), Jane Mansbridge (Harvard University) and Philippe Schmitter (European University Institute). We are also grateful for helpful advice, comments and suggestions from Yannick Glemarec, Executive Director, UN Green Climate Fund, and Milorad Kovacevic, Chief of Statistics, UN Human Development Report Office.
Co-Principal Investigators:
Sujian Guo
Jean Marc Coicaud
Research team /contributors (alphabetical order):
Yanfeng Gu (team leader)
Xuan Qin
Zhongyuan Wang
Chunman Zhang
Project Coordinator:
Xi Lin
Research Assistants:
Jingpu Chen, Xinyu Dai, Ziheng Guo, Xiaoyuan Li, Yawen Lin, Muye Nanshan, Zhenyu Wang, Xiaolan Xia, and Yuqing Zhang
I. Introduction
The Global Justice Index is a multiyear research project conducted at the Fudan-IAS to conceptualize and measure each country’s contribution to achieve greater global justice. In this study, we intend to provide our first-year achievements with the ranking of nation-states at the global level from 2010 to 2017. This study comprises four main sections. In the introduction, we discuss the development of the conceptual framework to justify our selection of dimensions and indicators for measurement. Next, in the section of methodology, we discuss the production, normalization, and aggregation of the raw data and the generation of the final results. The following section is the main findings, and we present the results through various visualization tools and provide regional comparisons for further analysis. In the last section, we discuss the applications and limitations of the index, and its potential further research trajectories.
Global justice is a broad concept composed of multilevel and multidimensional aspects belonging to both normative and empirical realities. A coherent, integrated theoretical framework that covers the normative basis and various empirical dimensions is therefore necessary to address some of the basic and important questions under study. Our study began with the conceptualization of global justice and was completed based on a theoretical paper on “Conceptualizing and Measuring Global Justice: Theories, Concepts, Principles and Indicators,” coauthored by the project leader, Sujian Guo, et al., published in Fudan Journal of the Humanities and Social Sciences (Vol. 12, No. 4, 2019). The paper discusses theories, concepts, evaluative principles, and methodologies related to the study of global justice.
In this paper above, we attempt to clarify how to conceptualize global justice, how conceptual indicators can be selected and justified by theories, and how those indicators can be conceptually consistent with the concept of global justice. Through the synthesis of multiple theories and intellectual traditions in various cultural and political contexts, we conceptualize global justice from three main approaches—rights based, goods based, and virtue based—to develop a theoretical framework with a normative basis for the following measurement. Rights-based conceptualization focuses on the basic principles, rules, and sources of legitimacy of justice (Universal Declaration of Human Rights, 1948; Rawls, 1971, 1999). Goods-based conceptualization concentrates on the material and institutional supports that the governments or institutions are obliged to provide (Arneson, 1989; Freeman, 2006; Nussbaum, 2006, 2011; Richardson, 2006). And virtue-based conceptualization regards justice as a virtue that an individual is willing to pursue rather than a regulation an individual is forced to comply with (Mo, 2003). The relationship between the three approaches of conceptualization is interdependent rather than separate, which indicates three interrelated components of a holistic whole. Additionally, the three approaches are complementary rather than competing, with the rights-based conceptualization forming the basic structure as the bones, the goods-based conceptualization providing substantial material supports as the muscles, and the virtue-based conceptualization emphasizing personal motivation and internalized willingness as a “heart” (Guo et al., 2019).
Based on the aforementioned theoretical framework, we propose two evaluative principles to further bridge the gap between theories and practice to determine and justify our selection of issue areas for evaluation. We call the two principles Common but Differentiated and Respective Capabilities (CBDR-RC) and Cosmopolitan but Due-diligent Responsibilities (CDDR). CBDR-RC addresses the issues “for which no single nation-state can be held directly accountable or responsible, matters that can only be tackled through the globally concerted efforts of all stakeholders” (Guo et al., 2019). For example, it is the responsibility of all to protect the climate system and ecological balance, and environmental protection is a task that cannot be handled by one country on its own. The principle of CBDR-RC, first adopted by the United Nations Framework Convention on Climate Change and reaffirmed in the Rio Declaration on Environment and Development, combines normative legitimacy and historical rationality. Although it was a principle that first aimed to determine the responsibilities of each country for climate change, it has been expanded to other global justice areas such as combatting transnational crime and global peacekeeping.
The second principle, CDDR, addresses that “all-nation-states are morally obligated to provide cosmopolitan aid, in which context the least advantaged will have a due-diligent responsibility” (Guo et al., 2019). This principle is based on the concept of “mutual accountability” proposed in the Paris Declaration on Aid Effectiveness, adopted in 2005 at the Second High-Level Forum on Aid Effectiveness to promote better cooperation between different actors in aid and development. This principle views such obligations as part of domestic affairs, such as anti-poverty and education policy, in the context of which the nation-states are expected to provide material and institutional assistance to their citizenry within their territories.
According to the principles of CBDR-RC and CDDR, we determine two clusters of global justice issue areas for practical measurement. Those issue areas that follow the principle of CBDR-RC are (1) climate change (global warming), (2) peacekeeping, (3) humanitarian aid, (4) terrorism and armed conflicts, and (5) cross-national criminal police cooperation, and those belonging to the principle of CDDR are (6) anti-poverty, (7) education, (8) public health, and (9) the protection of women and children. In the following sections, we present the more practical part of operationalization and measurement to assess the performance and contribution of each nation-state to promote justice at the global level.
II. Methodology: Construction of the global justice index
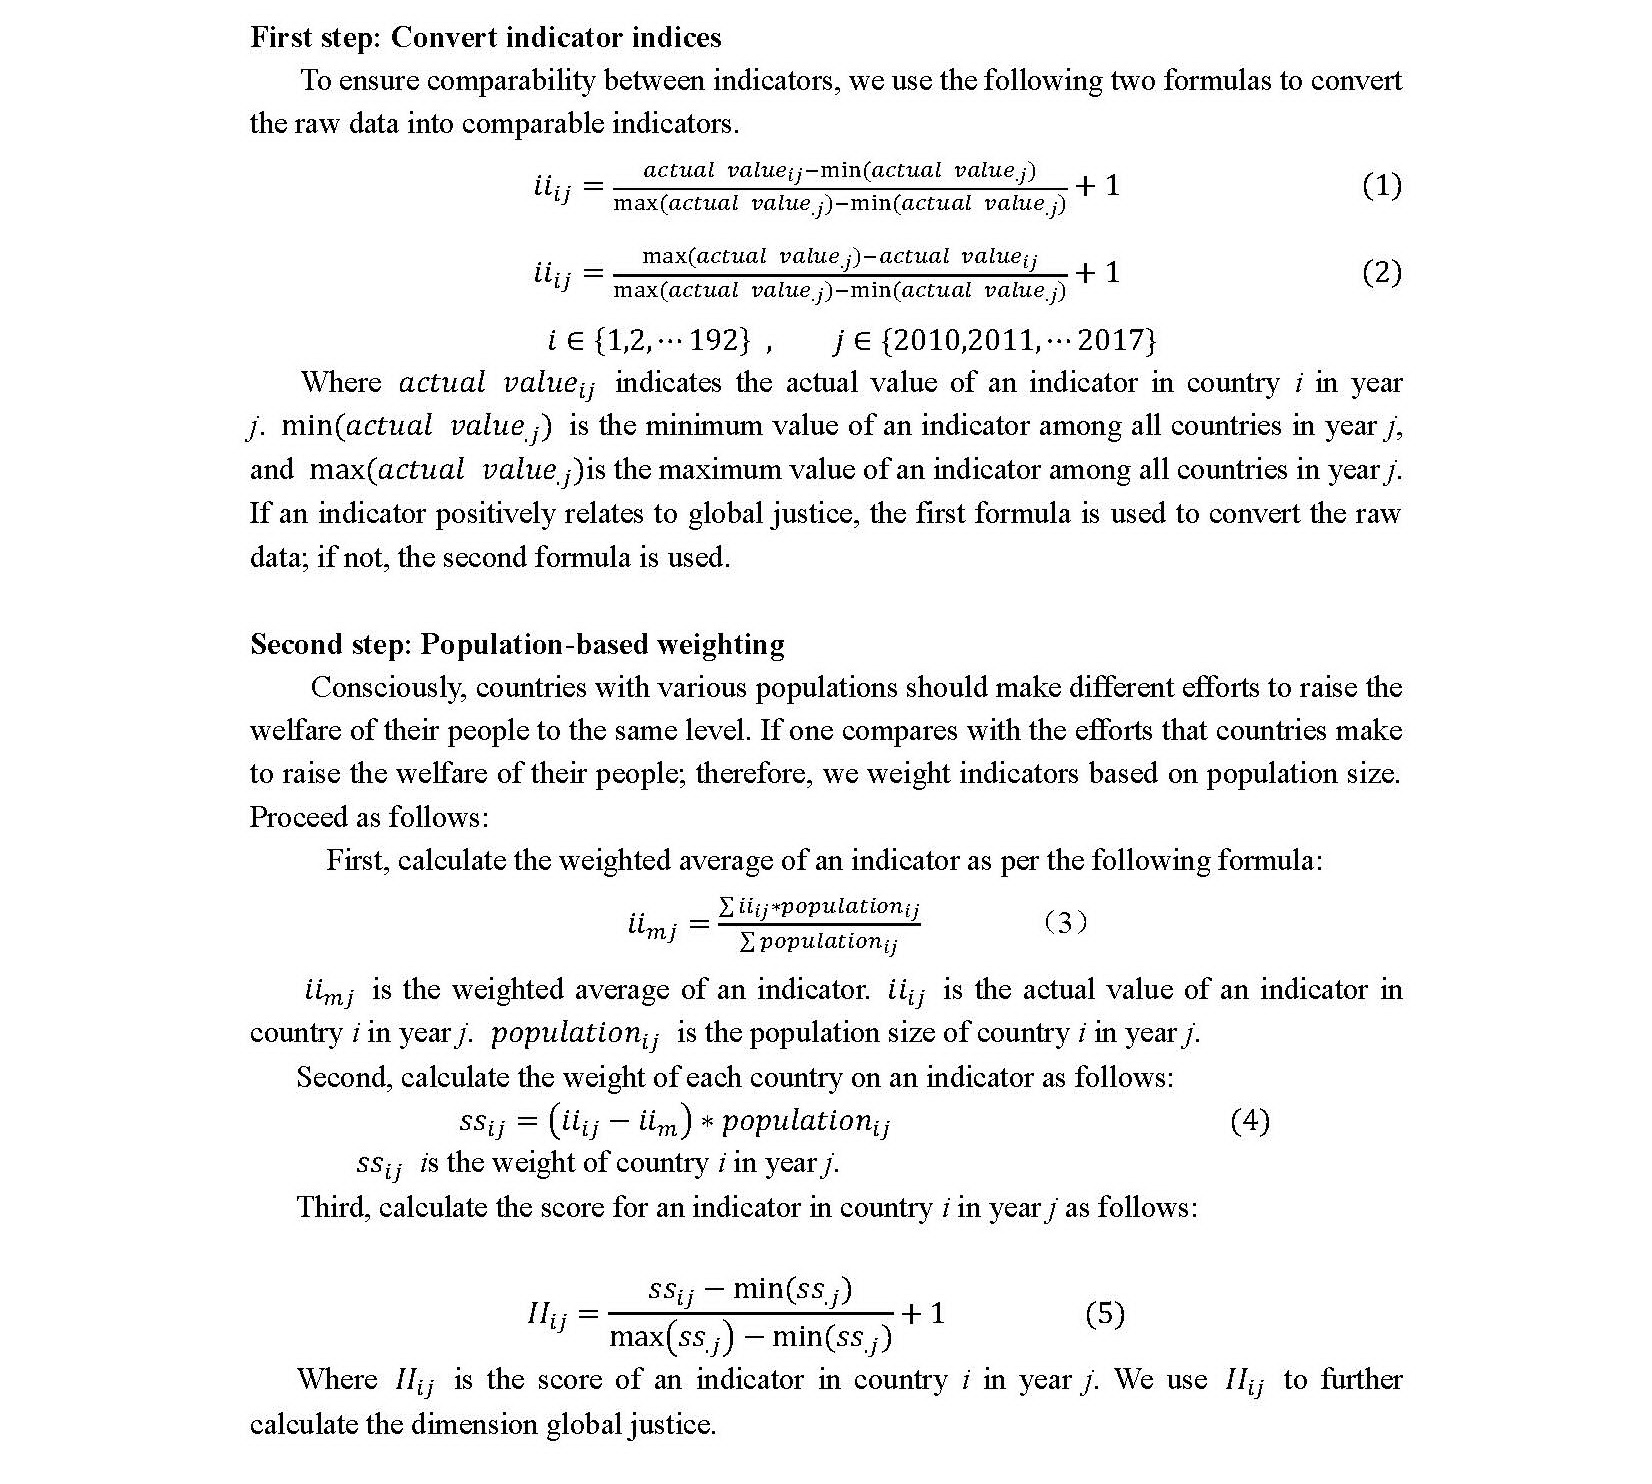
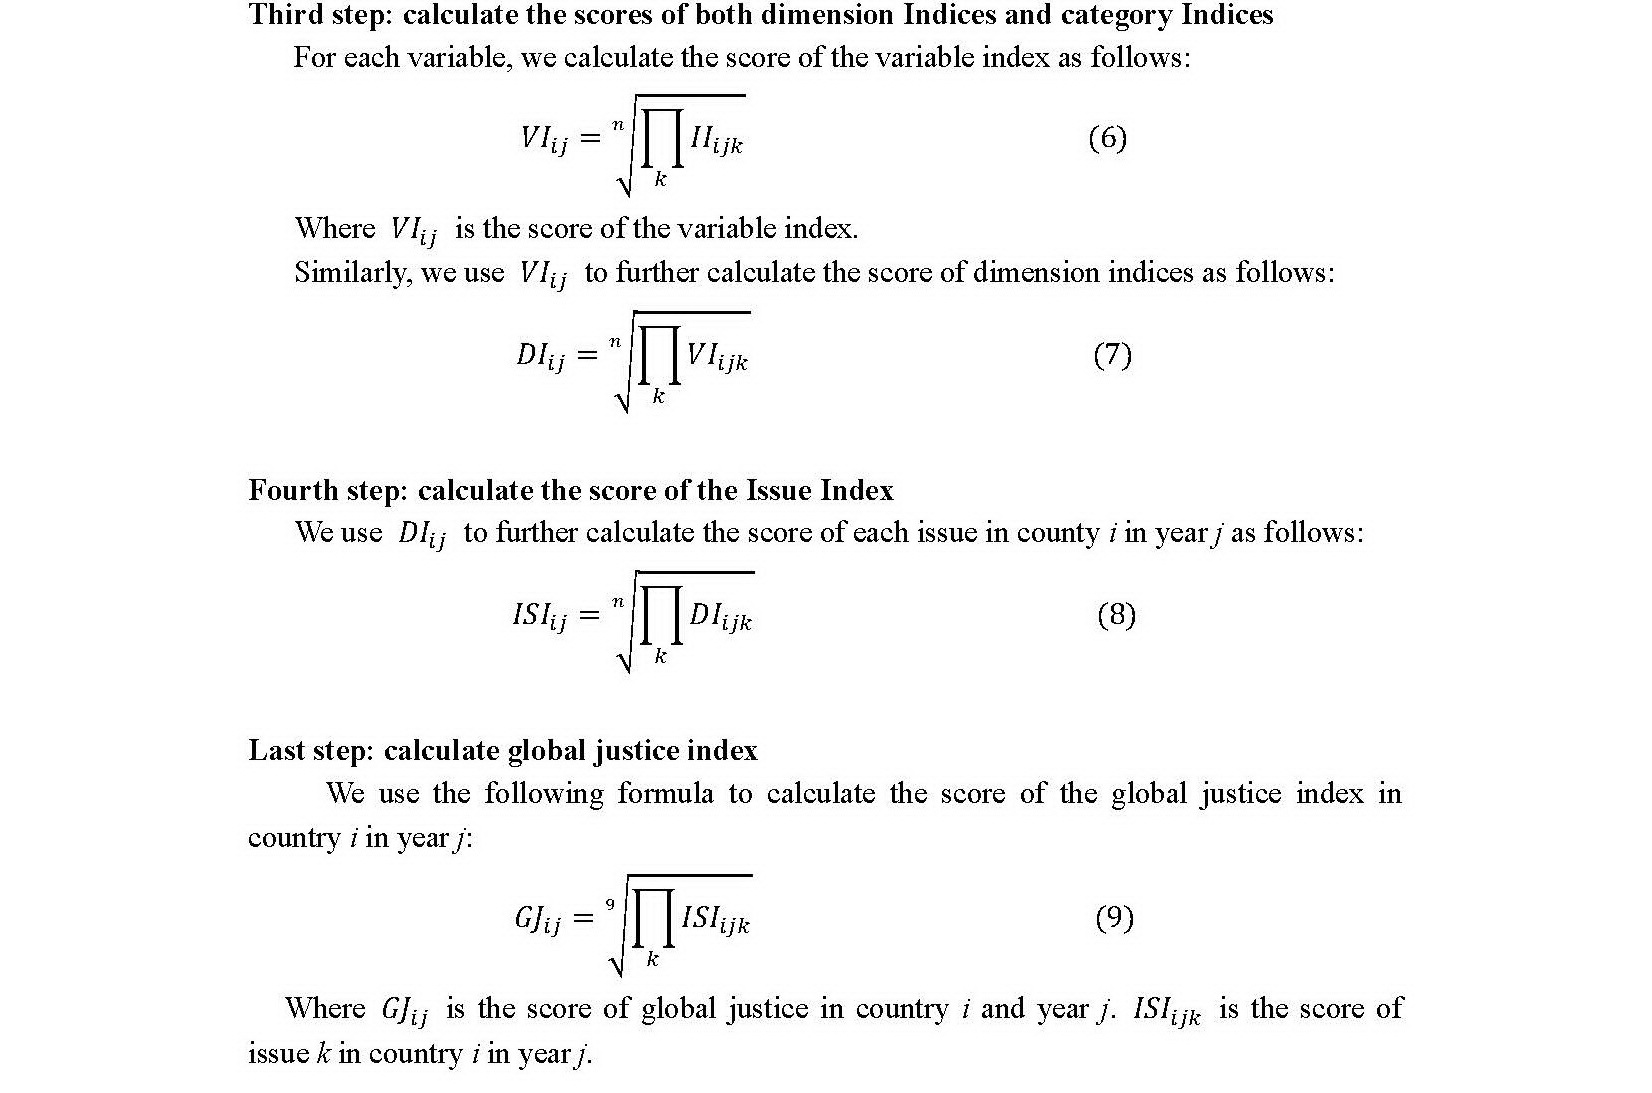
In this study, we classify our data into four levels: indicators, dimensions, categories, and issues. The first and the bottom levels of our data provide the information on indicators, which is our raw data. The second level is named dimensions, which usually comprises several related indicators. The third level is categories and comprises several related dimensions. And the last level is the issue index, usually calculated based on two categories: contribution and performance.
The global justice index is calculated as follows.
III. Findings
In this section, we will report the results of the measurement and country ranking in the identified 9 issue areas related to global justice based on available data sources. We will present dimensions, variables, indicators, data sources, and evaluate and rank the countries in terms of performance and contribution. We then present the results through various visualization tools and provide regional comparisons for further analysis.
Issue 1:Climate Change
This report studies countries’ efforts to promote global justice from the perspectives of climate change, peacekeeping, and other issues. Climate change and peacekeeping are issues for which no single actor can be held directly accountable or responsible. They are issue areas that can only be addressed through the globally concerted efforts of all stakeholders. Global warming is a real, disastrous phenomenon, with many destructive effects. Scientists have concluded that human influence is most likely the dominant cause of the observed warming since the mid-20th century. If all countries remain passive about climate change, the situation will worsen, with dramatic consequences globally. Alternately, if countries cooperate and coordinate to combat global warming, the negative impacts of climate change on this plane would be significantly alleviated.
Dimensions and Indicators
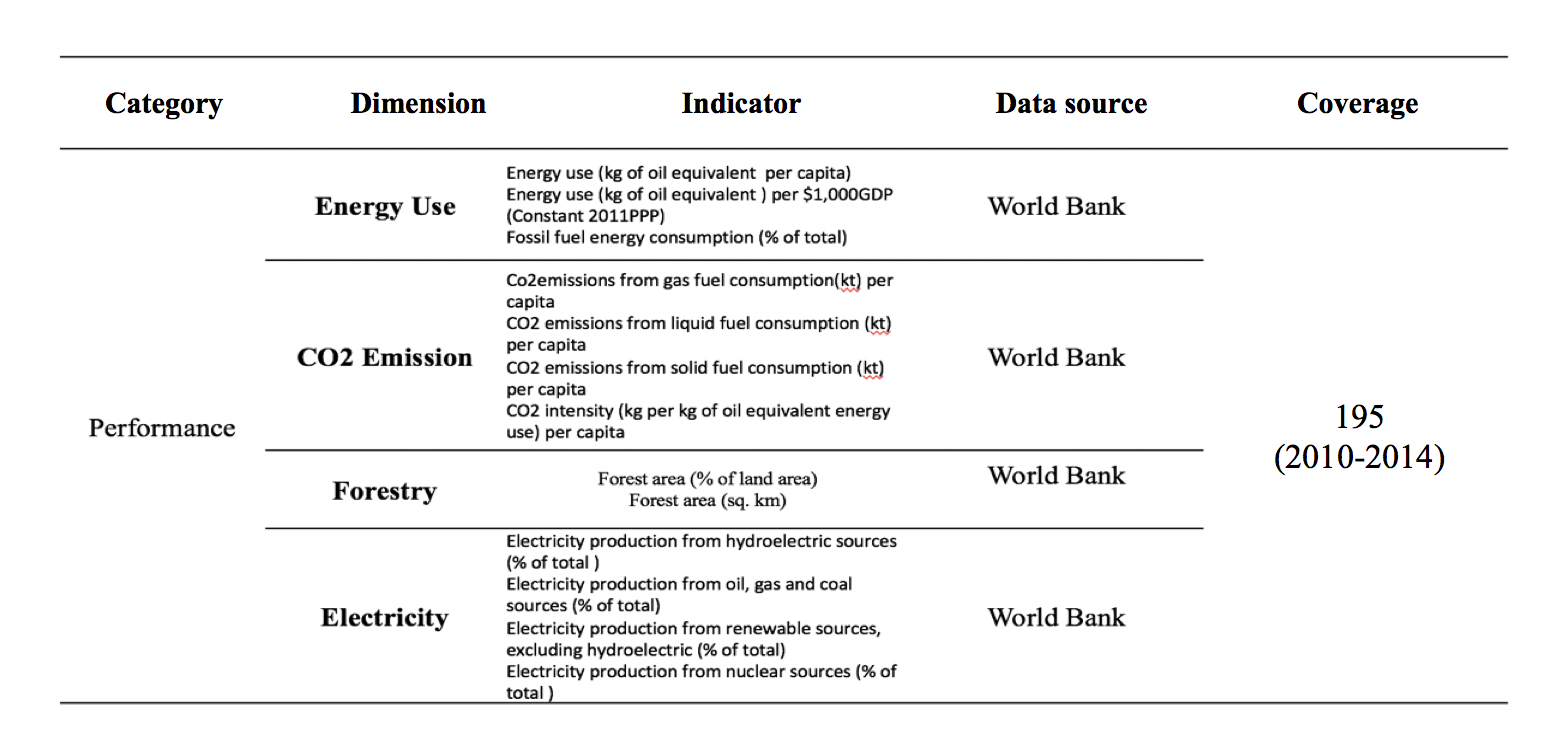
Today, countries attempt to resolve climate change problems by, for example, reducing CO2 emission, planting more trees, and supporting clean and renewable energy. Thus, our dimensions of climate change include CO2 emission, energy use, forestry, and electricity (Table 1). We have selected more than ten indicators derived from four dimensions. In the energy use dimension, our indicators include energy use per capita, energy use per 1000 dollars of gross domestic product and fossil fuel energy consumption. In the CO2 emission dimension, four indicators are used: CO2 emissions from gas, liquid, solid, and fuel consumption per capita and CO2 intensity per capita. The forestry dimension has two indicators. The electricity dimension has four indicators: electricity production from hydroelectric sources, oil, gas and coal sources, renewable sources, and nuclear sources. These data are all available for 195 countries from the World Bank. However, the time span is from 2000 to 2014 (2010–2014 is more important for our research purpose). We understand that these four dimensions and the indicators selected for this study may be not the most ideal, but they can to a large extent measure countries’ efforts to solve climate change problems.
Table 1: Data on Climate Change
Results
In this section, we present the ranking results of the countries’ contributions to global justice from a climate change perspective (Table 2). Table 2 shows five years of results from 2010 to 2014 in 195 countries.
Table 2: Country Ranking in the Climate Change Aspect of Promoting Global Justice
|
Country |
2010 |
2011 |
2012 |
2013 |
2014 |
|
Sweden |
2 |
2 |
2 |
2 |
1 |
|
Brazil |
3 |
3 |
3 |
3 |
2 |
|
Gabon |
8 |
9 |
5 |
4 |
3 |
|
Finland |
15 |
12 |
8 |
7 |
4 |
|
Paraguay |
5 |
7 |
6 |
5 |
5 |
|
Costa Rica |
6 |
8 |
7 |
8 |
6 |
|
Congo |
9 |
6 |
9 |
9 |
7 |
|
Democratic Republic of the Congo |
7 |
4 |
10 |
10 |
8 |
|
Cambodia |
29 |
26 |
15 |
11 |
9 |
|
Cameroon |
11 |
10 |
11 |
12 |
10 |
|
United Republic of Tanzania |
10 |
14 |
16 |
16 |
11 |
|
Nepal |
12 |
13 |
13 |
14 |
12 |
|
Myanmar |
4 |
5 |
4 |
6 |
13 |
|
France |
20 |
17 |
17 |
17 |
14 |
|
Slovenia |
26 |
24 |
24 |
23 |
15 |
|
Mozambique |
16 |
11 |
12 |
13 |
16 |
|
Suriname |
18 |
19 |
20 |
18 |
17 |
|
Switzerland |
22 |
21 |
21 |
21 |
18 |
|
Guatemala |
13 |
16 |
14 |
15 |
19 |
|
Ghana |
17 |
18 |
19 |
20 |
20 |
|
Angola |
14 |
15 |
18 |
19 |
21 |
|
Estonia |
24 |
22 |
22 |
24 |
22 |
|
Colombia |
23 |
20 |
23 |
26 |
23 |
|
Slovakia |
34 |
32 |
31 |
29 |
24 |
|
Montenegro |
21 |
27 |
25 |
22 |
25 |
|
Kenya |
31 |
29 |
32 |
35 |
26 |
|
Austria |
41 |
40 |
34 |
33 |
27 |
|
Albania |
30 |
28 |
26 |
27 |
28 |
|
Peru |
19 |
23 |
27 |
28 |
29 |
|
Latvia |
40 |
39 |
28 |
31 |
30 |
|
Panama |
32 |
35 |
30 |
32 |
31 |
|
Ethiopia |
48 |
33 |
35 |
36 |
32 |
|
Honduras |
27 |
25 |
29 |
30 |
33 |
|
Nicaragua |
42 |
46 |
38 |
34 |
34 |
|
Sri Lanka |
25 |
30 |
37 |
25 |
35 |
|
Norway |
50 |
38 |
36 |
44 |
36 |
|
Spain |
46 |
48 |
44 |
37 |
37 |
|
Uruguay |
38 |
51 |
60 |
47 |
38 |
|
New Zealand |
37 |
36 |
41 |
41 |
39 |
|
Cote d'Ivoire |
35 |
34 |
40 |
45 |
40 |
|
Portugal |
47 |
50 |
52 |
43 |
41 |
|
Georgia |
28 |
41 |
45 |
39 |
42 |
|
Romania |
53 |
58 |
57 |
48 |
43 |
|
Croatia |
59 |
64 |
59 |
53 |
44 |
|
Hungary |
60 |
60 |
55 |
52 |
45 |
|
Tajikistan |
36 |
37 |
42 |
40 |
46 |
|
Indonesia |
45 |
44 |
47 |
46 |
47 |
|
Senegal |
44 |
43 |
43 |
50 |
48 |
|
Ecuador |
49 |
47 |
46 |
55 |
49 |
|
El Salvador |
39 |
45 |
48 |
49 |
50 |
|
Bulgaria |
58 |
62 |
53 |
51 |
51 |
|
Namibia |
54 |
52 |
50 |
56 |
52 |
|
Canada |
64 |
61 |
54 |
58 |
53 |
|
Togo |
77 |
53 |
51 |
57 |
54 |
|
Lithuania |
76 |
71 |
69 |
61 |
55 |
|
Czechia |
69 |
68 |
64 |
63 |
56 |
|
Philippines |
56 |
55 |
56 |
59 |
57 |
|
Republic of Korea |
62 |
59 |
62 |
66 |
58 |
|
Belgium |
72 |
63 |
63 |
62 |
59 |
|
Bolivia (Plurinational State of) |
52 |
54 |
58 |
60 |
60 |
|
Nigeria |
55 |
56 |
61 |
64 |
61 |
|
Russian Federation |
65 |
65 |
65 |
65 |
62 |
|
Germany |
63 |
66 |
66 |
68 |
63 |
|
Italy |
82 |
81 |
73 |
69 |
64 |
|
Denmark |
86 |
80 |
71 |
74 |
65 |
|
Benin |
66 |
67 |
67 |
67 |
66 |
|
Bosnia and Herzegovina |
73 |
85 |
81 |
76 |
67 |
|
Chile |
75 |
73 |
70 |
71 |
68 |
|
Japan |
43 |
57 |
68 |
70 |
69 |
|
Republic of North Macedonia |
68 |
75 |
79 |
73 |
70 |
|
Dominican Republic |
78 |
76 |
74 |
75 |
71 |
|
India |
70 |
70 |
72 |
72 |
72 |
|
United States of America |
85 |
82 |
76 |
77 |
73 |
|
Malaysia |
80 |
79 |
77 |
82 |
74 |
|
Pakistan |
79 |
77 |
78 |
78 |
75 |
|
Serbia |
87 |
91 |
86 |
88 |
76 |
|
Greece |
90 |
92 |
90 |
83 |
77 |
|
Mexico |
83 |
84 |
83 |
84 |
78 |
|
Kyrgyzstan |
74 |
74 |
82 |
79 |
79 |
|
Armenia |
61 |
72 |
80 |
80 |
80 |
|
Niger |
81 |
83 |
84 |
85 |
81 |
|
United Kingdom of Great Britain and Northern Ireland |
99 |
94 |
92 |
86 |
82 |
|
Haiti |
71 |
78 |
75 |
81 |
83 |
|
Ukraine |
96 |
89 |
91 |
89 |
84 |
|
Thailand |
88 |
86 |
85 |
87 |
85 |
|
Jamaica |
91 |
90 |
87 |
90 |
86 |
|
China |
94 |
95 |
93 |
92 |
87 |
|
Mauritius |
84 |
88 |
89 |
91 |
88 |
|
Poland |
98 |
98 |
96 |
96 |
89 |
|
Bangladesh |
92 |
93 |
95 |
95 |
90 |
|
Botswana |
89 |
87 |
88 |
93 |
91 |
|
Turkey |
93 |
96 |
94 |
94 |
92 |
|
Argentina |
97 |
97 |
97 |
97 |
93 |
|
Ireland |
103 |
102 |
100 |
100 |
94 |
|
Morocco |
95 |
99 |
98 |
98 |
95 |
|
Belarus |
100 |
100 |
99 |
99 |
96 |
|
Iceland |
101 |
101 |
101 |
101 |
97 |
|
Cyprus |
111 |
112 |
105 |
103 |
98 |
|
Australia |
108 |
108 |
108 |
107 |
99 |
|
Netherlands |
107 |
106 |
102 |
108 |
100 |
|
Brunei Darussalam |
114 |
110 |
102 |
101 |
|
|
Tunisia |
104 |
104 |
103 |
106 |
102 |
|
Iraq |
106 |
107 |
107 |
109 |
103 |
|
Singapore |
112 |
110 |
104 |
110 |
104 |
|
Republic of Moldova |
110 |
109 |
111 |
104 |
105 |
|
Azerbaijan |
102 |
103 |
109 |
111 |
106 |
|
Lebanon |
105 |
105 |
106 |
105 |
107 |
|
Israel |
115 |
116 |
116 |
114 |
108 |
|
South Africa |
113 |
111 |
112 |
112 |
109 |
|
Egypt |
109 |
113 |
113 |
113 |
110 |
|
Mongolia |
117 |
118 |
115 |
116 |
111 |
|
Jordan |
116 |
117 |
117 |
118 |
112 |
|
Luxembourg |
126 |
127 |
124 |
121 |
113 |
|
Algeria |
118 |
119 |
118 |
120 |
114 |
|
Iran (Islamic Republic of) |
119 |
120 |
119 |
119 |
115 |
|
Kazakhstan |
122 |
123 |
122 |
123 |
116 |
|
Libya |
121 |
122 |
121 |
122 |
117 |
|
Malta |
123 |
124 |
123 |
124 |
118 |
|
United Arab Emirates |
126 |
126 |
126 |
119 |
|
|
Saudi Arabia |
124 |
125 |
125 |
125 |
120 |
|
Oman |
125 |
128 |
127 |
121 |
|
|
Kuwait |
129 |
127 |
128 |
122 |
|
|
Bahrain |
130 |
123 |
|||
|
Trinidad and Tobago |
127 |
131 |
128 |
129 |
124 |
|
Qatar |
130 |
125 |
|||
|
Eritrea |
67 |
69 |
|||
|
Uzbekistan |
120 |
121 |
120 |
117 |
|
|
Venezuela (Bolivarian Republic of) |
57 |
49 |
49 |
54 |
|
|
Viet Nam |
51 |
42 |
39 |
42 |
|
|
Yemen |
114 |
115 |
114 |
115 |
|
|
Zambia |
1 |
1 |
1 |
1 |
|
|
Zimbabwe |
33 |
31 |
33 |
38 |
Table 2 shows the countries’ climate-change ranking from 2010 to 2014. Due to the missing value problem, some countries (e.g., Afghanistan, Zambia, Zimbabwe, Monaco) do not have full data for the year 2014. However, 116 countries in Table 2 have full data. In general, we observe that developed countries have performed relatively better than developing countries in terms of promoting global justice from a climate change perspective. In most cases, countries’ rankings have been stable from 2010 to 2014.
Figure 1: 2014 index ranking of climate change on a world map

Figure 1 shows that the top ten countries in 2014 are Sweden, Brazil, Gabon, Finland, Paraguay, Costa Rica, Congo, Democratic Republic of the Congo, Cambodia, and Cameroon. Sweden and Finland are developed countries and the remaining eight countries are developing countries. Brazil, Costa Rica, and Paraguay are South American countries. Cambodia is an Asian country. Gabon, Democratic Republic of the Congo, Cameroon, and Congo are African countries. China ranks 87th in 2014, and the United States ranks 73rd in 2014. This finding implies that the two largest economies must make more contributions despite the progress achieved prior to 2014.
Issue 2:Peacekeeping
Similar to climate change, peacekeeping has no single actor that can be held directly accountable or responsible. UN peacekeeping is an attempt, after peace has been negotiated or imposed by internal and external players, to address the causes of current hostility and to build local capacity for conflict resolution. A global effort is required to maintain international peace and security. All countries—big and small, developed and developing—can participate and make contributions.
Dimensions and Indicators
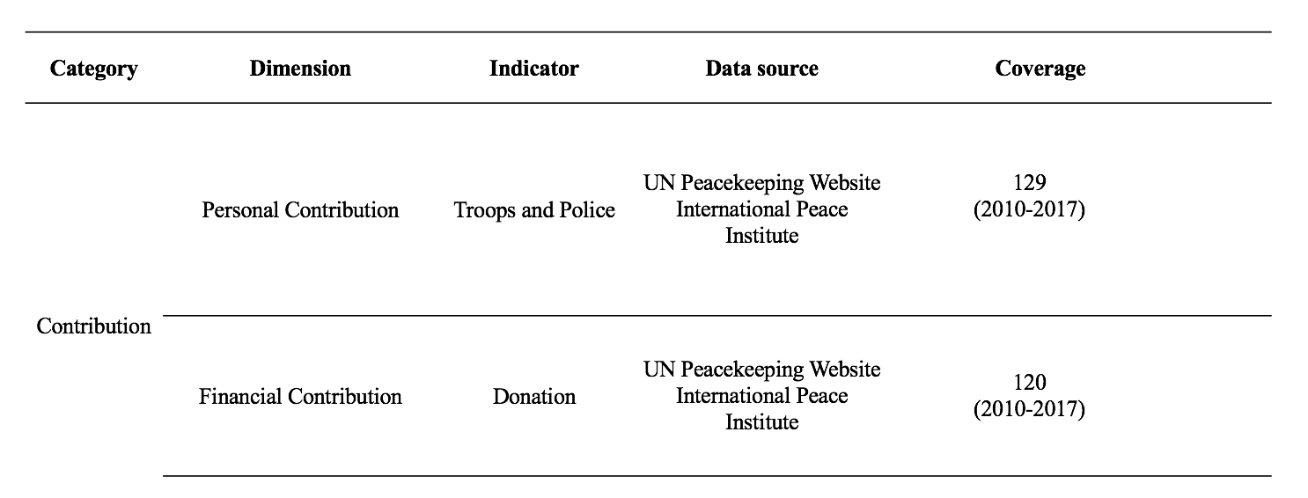
To measure a country’s effort to promote global justice by contributing to UN peacekeeping, our dimensions include personnel contribution and financial contribution (Table 2). The personnel contribution dimension is measured by the troops and police contribution indicator. The financial contribution dimension is measured by the financial donation contribution. Our data source is the United Nations peacekeeping official website and International Peace Institute. Approximately 120 countries are studied in this research. The time span for our study is from 2010 to 2017.
Table 3: Data on Peacekeeping
Results
In this section, we present the ranking result of countries’ contributions to global justice from the peacekeeping perspective (Table 4).
Table 4: Country Ranking in the Peacekeeping Aspect of Promoting Global Justice
|
Country |
2010 |
2011 |
2012 |
2013 |
2014 |
2015 |
2016 |
2017 |
|
United States of America |
1 |
1 |
1 |
1 |
1 |
1 |
1 |
1 |
|
Ethiopia |
19 |
15 |
5 |
5 |
5 |
3 |
2 |
2 |
|
India |
4 |
4 |
4 |
4 |
3 |
5 |
3 |
3 |
|
Bangladesh |
3 |
2 |
2 |
2 |
2 |
2 |
5 |
4 |
|
Pakistan |
2 |
3 |
3 |
3 |
4 |
4 |
4 |
5 |
|
China |
11 |
12 |
7 |
9 |
8 |
7 |
6 |
6 |
|
Rwanda |
13 |
13 |
8 |
7 |
6 |
6 |
7 |
7 |
|
Nepal |
9 |
9 |
11 |
8 |
7 |
8 |
8 |
li:nth-child(3)").addClass("act"); |